

Prerequisites
The following content assumes that you have Python and Django installed on your machine. You can find the information on how to do that on the official Django website. It would be best if you also had ActiveReportsJS installed on your device. If you don’t have it, you can obtain it from the ActiveReportsJS website.
Create a Django Application
For this tutorial, we will use the Django web framework. To create a new Django application, run the following commands from the terminal or the command prompt.
django-admin startproject ReportingOnDjango
cd ReportingOnDjango
py manage.py startapp sales_api
Then open the newly created ReportingOnDjango directory in your favorite code editor, such as Visual Studio Code. Open the settings.py file in the ReportingOnDjango folder and add the ‘sales_api.apps.SalesApiConfig’ item into the INSTALLED_APPS array so that it looks like the following:
INSTALLED_APPS = [
    'sales_api.apps.SalesApiConfig',
    'django.contrib.admin',
    'django.contrib.auth',
    'django.contrib.contenttypes',
    'django.contrib.sessions',
    'django.contrib.messages',
    'django.contrib.staticfiles',
]
Create a Data Model for the JSON API
We will use the Sales dataset that you can download from the E for Excel website. It offers datasets of various sizes, starting from 100 records to 5M records. For simplicity, we will use the first dataset, which has 100 records.
There are many fields in the dataset, but we will only use several of them in this tutorial. To create a data model for the JSON API, replace the contents of sales_api/models.py with the following:
from django.db import models

class Sale(models.Model):
    region = models.CharField(max_length=200)
    itemType = models.CharField(max_length=200)
    unitsSold = models.IntegerField()
and run the following commands from the terminal or command prompt:
py manage.py makemigrations sales_api
python manage.py migrate
Add Application Data
We will use the Sales dataset that you can download from the E for Excel website. It offers datasets of various sizes, starting from 100 records to 5M records. For simplicity, we will use the first dataset, which has 100 records.
Download and unzip the data from the 100-Sales-Records.zip archive into the root directory of the application.
Run the python manage.py shell command from the terminal or command prompt to start the interactive Python shell and enter the following commands:
from sales_api.models import Sale
import csv
with open('100 Sales Records.csv', newline='') as csvfile:
reader = csv.reader(csvfile, delimiter=',')
next(reader)
for row in reader:
Sale.objects.create(region=row[0], itemType=row[2], unitsSold=row[8])
Configure JSON API Endpoint
The easiest way to configure the JSON API endpoint that returns the list of sales is to use the Django REST Framework. You can install it by running the pip install djangorestframework command in the terminal or command prompt and then adding the ‘rest_framework’ item into the INSTALLED_APPS array in the ReportingOnDjango\settings.py file.
Add the ‘serializers.py’ file into the sales_api folder and replace its content with the following:
from rest_framework import serializers

from .models import Sale

class SaleSerializer(serializers.HyperlinkedModelSerializer):
    class Meta:
        model = Sale
        fields = ('region', 'itemType', 'unitsSold')
Then replace the content of the view.py file in the sales_api folder with the following:
from rest_framework import viewsets

from .serializers import SaleSerializer
from .models import Sale

class SaleViewSet(viewsets.ModelViewSet):
    queryset = Sale.objects.all()
    serializer_class = SaleSerializer
To server static files, configure the STATIC_ROOT variable in the settings.py file:
STATIC_ROOT = BASE_DIR / 'sales_api/static/',
Finally, replace the content of the ‘urls.py’ file in the ReportingOnDjango folder with the following:
from django.contrib import admin
from django.urls import include, path
from rest_framework import routers
from sales_api import views

router = routers.DefaultRouter()
router.register(r'sales', views.SaleViewSet)

urlpatterns = [
    path('api/', include(router.urls)),
    path('admin/', admin.site.urls),
] + static(settings.STATIC_URL, document_root=settings.STATIC_ROOT)
Run the server using the py manage.py runserver 8080 and open the http://localhost:8080/api/sales URL. If you follow the steps shown above, the page should display the list of sales.
Create an ActiveReportsJS Report
Let’s now create a report that visualizes the data from the JSON API.
In the Standalone Report Designer Application, click the File menu and select the Continuous Page Layout template for a newly created report.
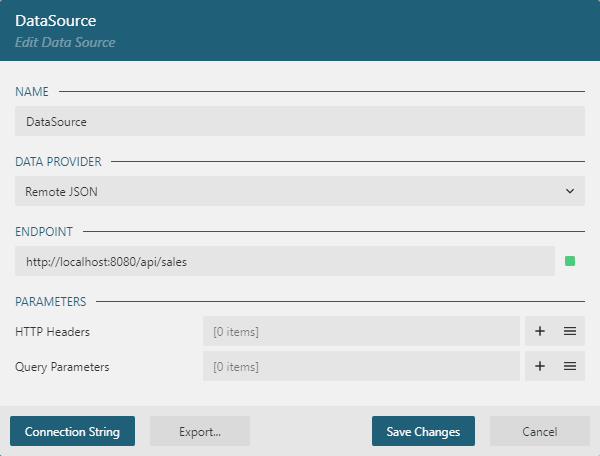
Open the Data panel of the property inspector and click the Add button.
In the Data Source editor dialog, type http://localhost:8080/api/sales in the ENDPOINT field and click the Save Changes button.
Click the + icon near DataSource in the Data panel.
In the Data Set Editor dialog, type Sales in the NAME field and $.* in the JSON Path field.
Click the Validate button, ensure that the DataBase Fields section displays [3 items] text, and click the Save Changes button.

Expand the toolbox using the Hamburger menu located on the toolbar’s left side.
Drag and drop the Chart item from the toolbox to the report page area’s top-left corner. The Chart Wizard dialog appears. Select the Bar type and click the Next button on the first screen.
On the second screen of the dialog, configure the data as shown in the following image and click the Next button.
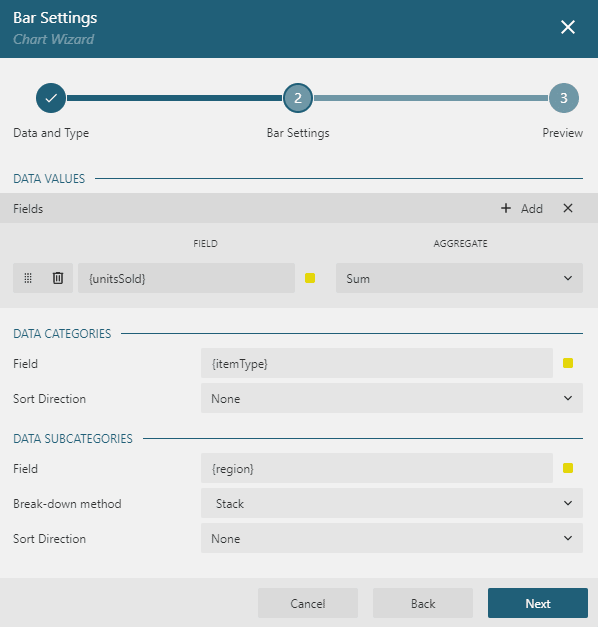
On the third screen, click the Finish button.
Resize the chart report item to fill the entire width of the report page. Click the chart legend to load its properties into the properties panel and set the Orientation property to Horizontal and Position property to Bottom.
Click the File menu and save the newly created report in the “ReportingOnDjango\sales_api\static”folder of the application under the name SalesReport.rdlx-json.
Create a static HTML page to display the report
In the “ReportingOnDjango\sales_api\static”folder of the application, create the report.html file and replace its content with the following code:
<!DOCTYPE html>
<html lang="en">
<head>
    <meta charset="UTF-8">
    <meta http-equiv="X-UA-Compatible" content="IE=edge">
    <meta name="viewport" content="width=device-width, initial-scale=1.0">
    <title>Sales Report</title>
    <link
    rel="stylesheet"
    href="https://cdn.grapecity.com/activereportsjs/3.latest/styles/ar-js-ui.css"
    type="text/css"
  />
  <link
    rel="stylesheet"
    href="https://cdn.grapecity.com/activereportsjs/3.latest/styles/ar-js-viewer.css"
    type="text/css"
  />
  <script src="https://cdn.grapecity.com/activereportsjs/3.latest/dist/ar-js-core.js"></script>
  <script src="https://cdn.grapecity.com/activereportsjs/3.latest/dist/ar-js-viewer.js"></script>
  <script src="https://cdn.grapecity.com/activereportsjs/3.latest/dist/ar-js-pdf.js"></script>
  <style>
    #viewer-host {
      width: 100%;
      height: 100vh;
    }
  </style>
</head>

<body>
    <div id="viewer-host"></div>
    <script>
        var viewer = new ActiveReports.Viewer("#viewer-host");
        viewer.open('SalesReport.rdlx-json');
      </script>
</body>
</html>
Open the http://localhost:8080/static/report.html in the browser to see the report. If you followed the steps correctly, you should see a report displaying the JSON API data.