


Takeaways from the blog
In this article, we do prediction using machine learning which leads to below takeaways:
- EDA: Learn the complete process of EDA
- Data analysis: Learn to withdraw some insights from the dataset both mathematically and visualize it.
- Data visualization: Visualising the data to get better insight from it.
- Feature engineering: We will also see what kind of stuff we can do in the feature engineering part.
About the dataset
- Airline: So this column will have all the types of airlines like Indigo, Jet Airways, Air India, and many more.
- Date_of_Journey: This column will let us know about the date on which the passenger’s journey will start.
- Source: This column holds the name of the place from where the passenger’s journey will start.
- Destination: This column holds the name of the place to where passengers wanted to travel.
- Route: Here we can know about that what is the route through which passengers have opted to travel from his/her source to their destination.
- Arrival_Time: Arrival time is when the passenger will reach his/her destination.
- Duration: Duration is the whole period that a flight will take to complete its journey from source to destination.
- Total_Stops: This will let us know in how many places flights will stop there for the flight in the whole journey.
- Additional_Info: In this column, we will get information about food, kind of food, and other amenities.
- Price: Price of the flight for a complete journey including all the expenses before onboarding.
Importing Libraries
import numpy as np
import pandas as pd

import matplotlib.pyplot as plt
import seaborn as sns

from sklearn.preprocessing import StandardScaler
from sklearn.model_selection import train_test_split
from sklearn.metrics import mean_squared_error as mse
from sklearn.metrics import r2_score
from math import sqrt
from sklearn.linear_model import Ridge
from sklearn.linear_model import Lasso
from sklearn.tree import DecisionTreeRegressor
from sklearn.ensemble import RandomForestRegressor
from sklearn.preprocessing import LabelEncoder
from sklearn.model_selection import KFold
from sklearn.model_selection import train_test_split
from sklearn.model_selection import GridSearchCV
from sklearn.model_selection import RandomizedSearchCV

from prettytable import PrettyTable
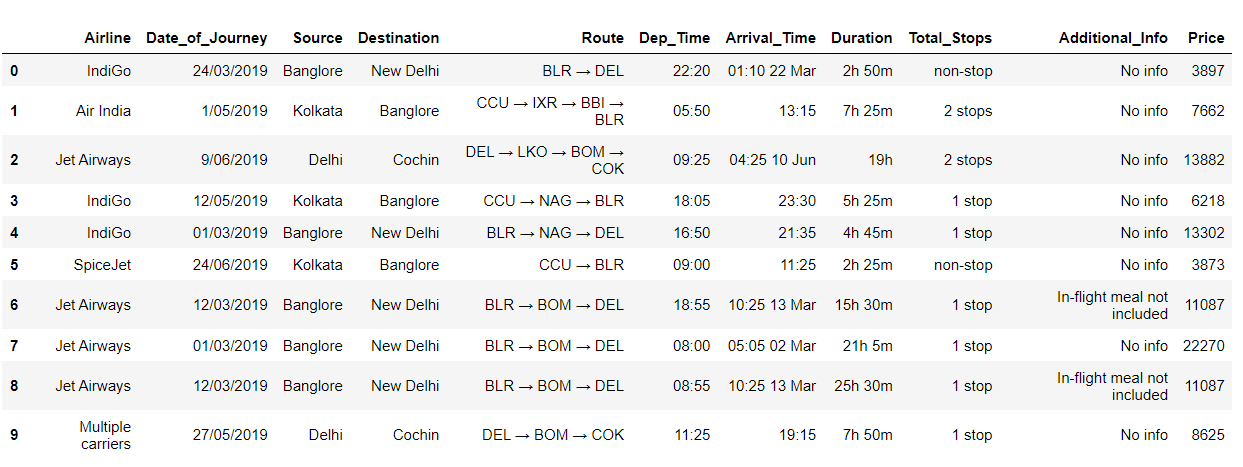
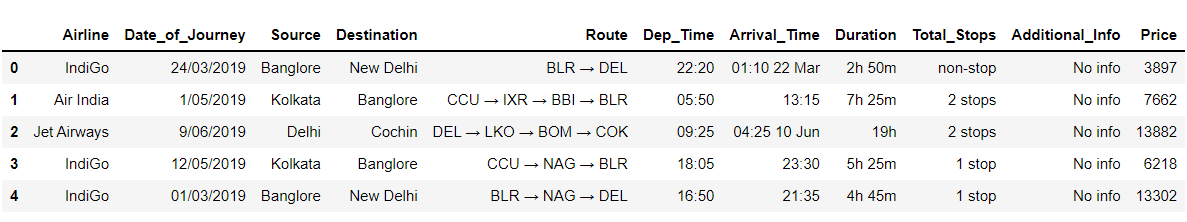
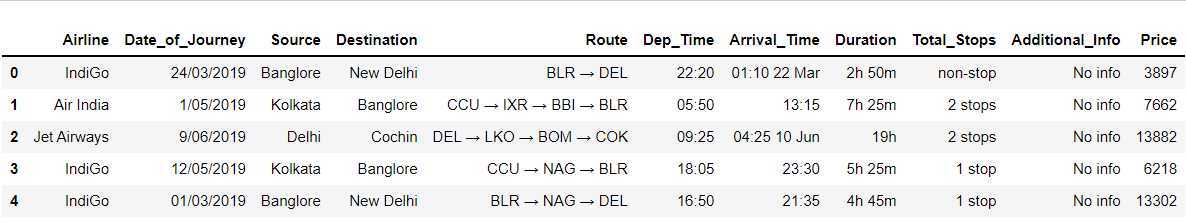
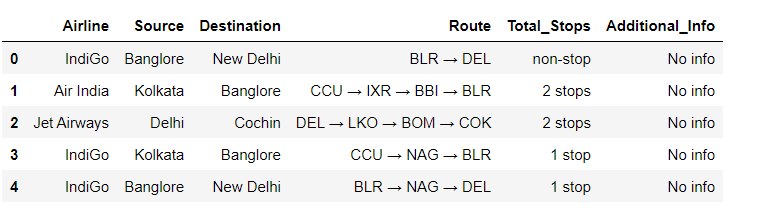
Reading the training data of our dataset
train_df = pd.read_excel("Data_Train.xlsx")
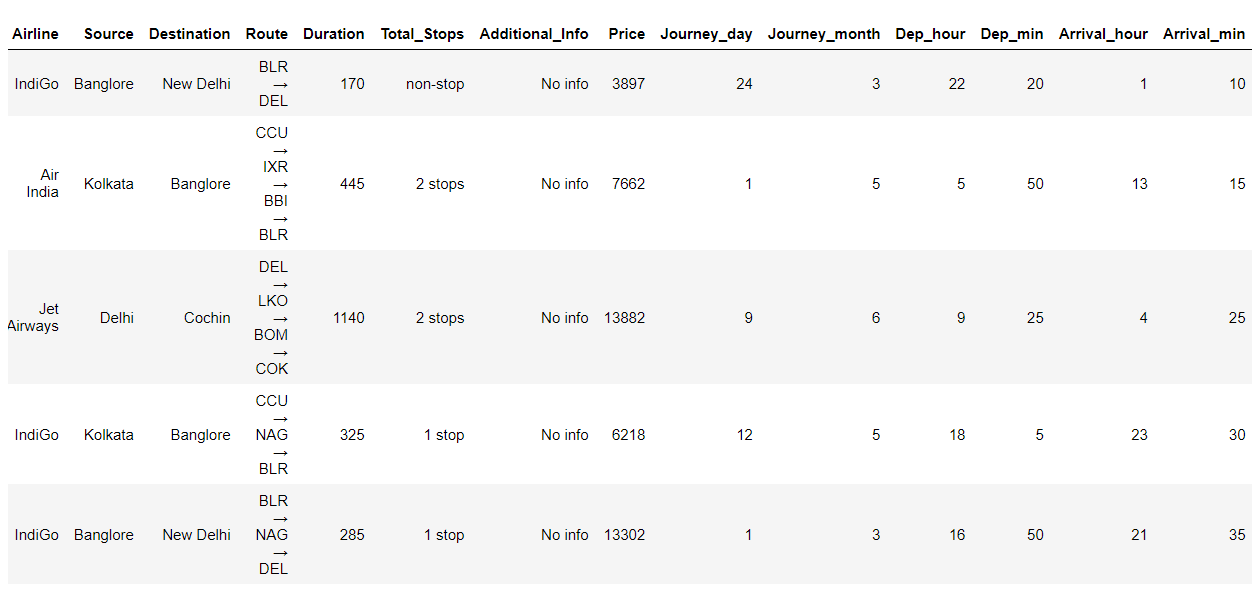
train_df.head(10)Output:
Exploratory Data Analysis (EDA)
Now here we will be looking at the kind of columns our dataset has.
train_df.columns
Output:
Index(['Airline', 'Date_of_Journey', 'Source', 'Destination', 'Route',
'Dep_Time', 'Arrival_Time', 'Duration', 'Total_Stops',
'Additional_Info', 'Price'],
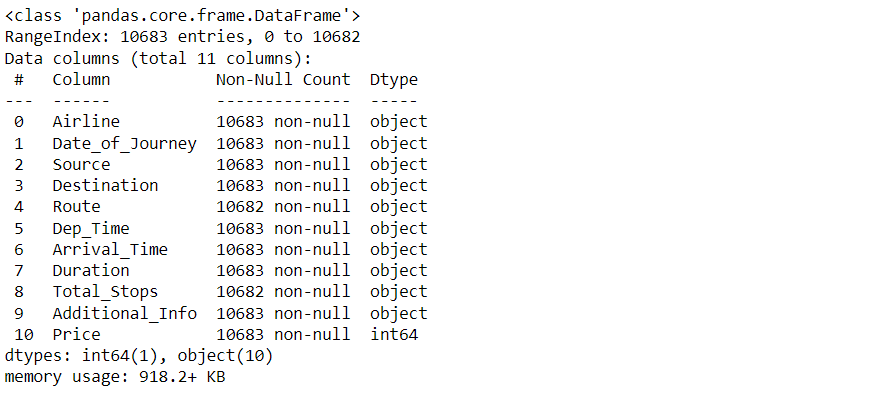
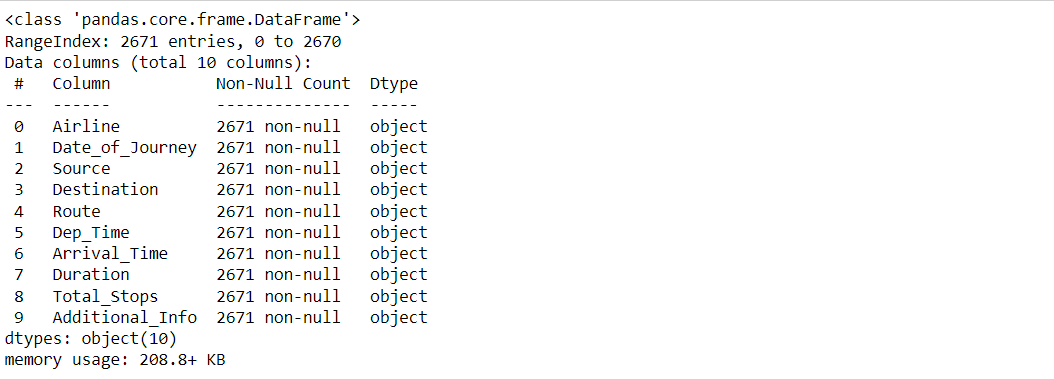
dtype='object')Here we can get more information about our dataset
train_df.info()
Output:
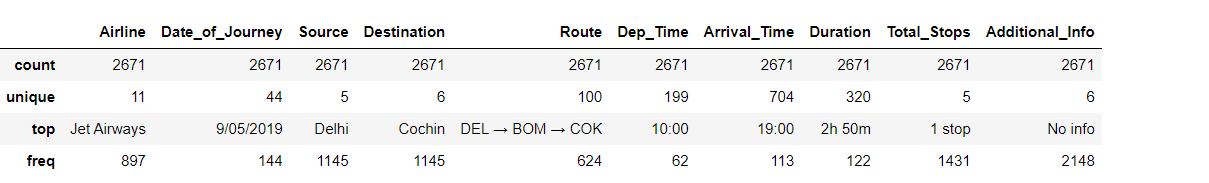
To know more about the dataset
train_df.describe()
Output:

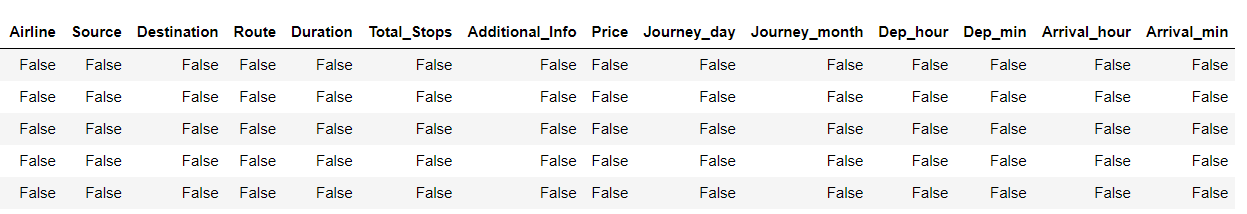
Now while using the IsNull function we will gonna see the number of null values in our dataset
train_df.isnull().head()
Output:
Now while using the IsNull function and sum function we will gonna see the number of null values in our dataset
train_df.isnull().sum()
Output:
Airline            0
Date_of_Journey    0
Source             0
Destination        0
Route              1
Dep_Time           0
Arrival_Time       0
Duration           0
Total_Stops        1
Additional_Info    0
Price              0
dtype: int64
Dropping NAN values
train_df.dropna(inplace = True)
Duplicate values
train_df[train_df.duplicated()].head()
Output:
Here we will be removing those repeated values from the dataset and keeping the in-place attribute to be true so that there will be no changes.
train_df.drop_duplicates(keep='first',inplace=True)
train_df.head()
Output:
train_df.shape
Output:
(10462, 11)
Checking the Additional_info column and having the count of unique types of values.
train_df["Additional_Info"].value_counts()
Output:
No info                         8182
In-flight meal not included     1926
No check-in baggage included     318
1 Long layover                    19
Change airports                    7
Business class                     4
No Info                            3
1 Short layover                    1
2 Long layover                     1
Red-eye flight                     1
Name: Additional_Info, dtype: int64
Checking the different Airlines
train_df["Airline"].unique()
Output:
array(['IndiGo', 'Air India', 'Jet Airways', 'SpiceJet',
       'Multiple carriers', 'GoAir', 'Vistara', 'Air Asia',
       'Vistara Premium economy', 'Jet Airways Business',
       'Multiple carriers Premium economy', 'Trujet'], dtype=object)
Checking the different Airline Routes
train_df["Route"].unique()
Output: See the code.
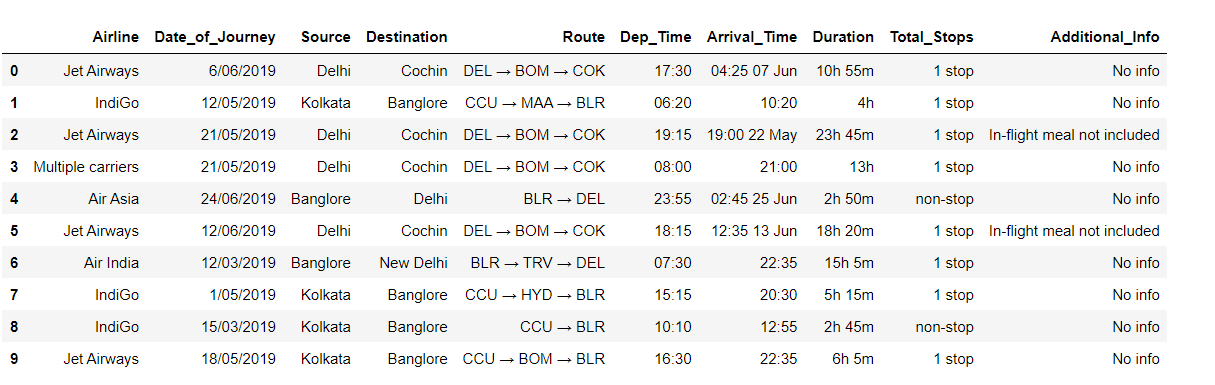
Now let’s look at our testing dataset
test_df = pd.read_excel("Test_set.xlsx")
test_df.head(10)
Output:
Now here we will be looking at the kind of columns our testing data has.
test_df.columns
Output:
Index(['Airline', 'Date_of_Journey', 'Source', 'Destination', 'Route',
       'Dep_Time', 'Arrival_Time', 'Duration', 'Total_Stops',
       'Additional_Info'],
      dtype='object')
Information about the dataset
test_df.info()
Output:
To know more about the testing dataset
test_df.describe()
Output:
Now while using the IsNull function and sum function we will gonna see the number of null values in our testing data
test_df.isnull().sum()
Output:
Airline            0
Date_of_Journey    0
Source             0
Destination        0
Route              0
Dep_Time           0
Arrival_Time       0
Duration           0
Total_Stops        0
Additional_Info    0
dtype: int64
Data Visualization
Plotting Price vs Airline plot
sns.catplot(y = "Price", x = "Airline", data = train_df.sort_values("Price", ascending = False), kind="boxen", height = 8, aspect = 3)
plt.show()
Output:
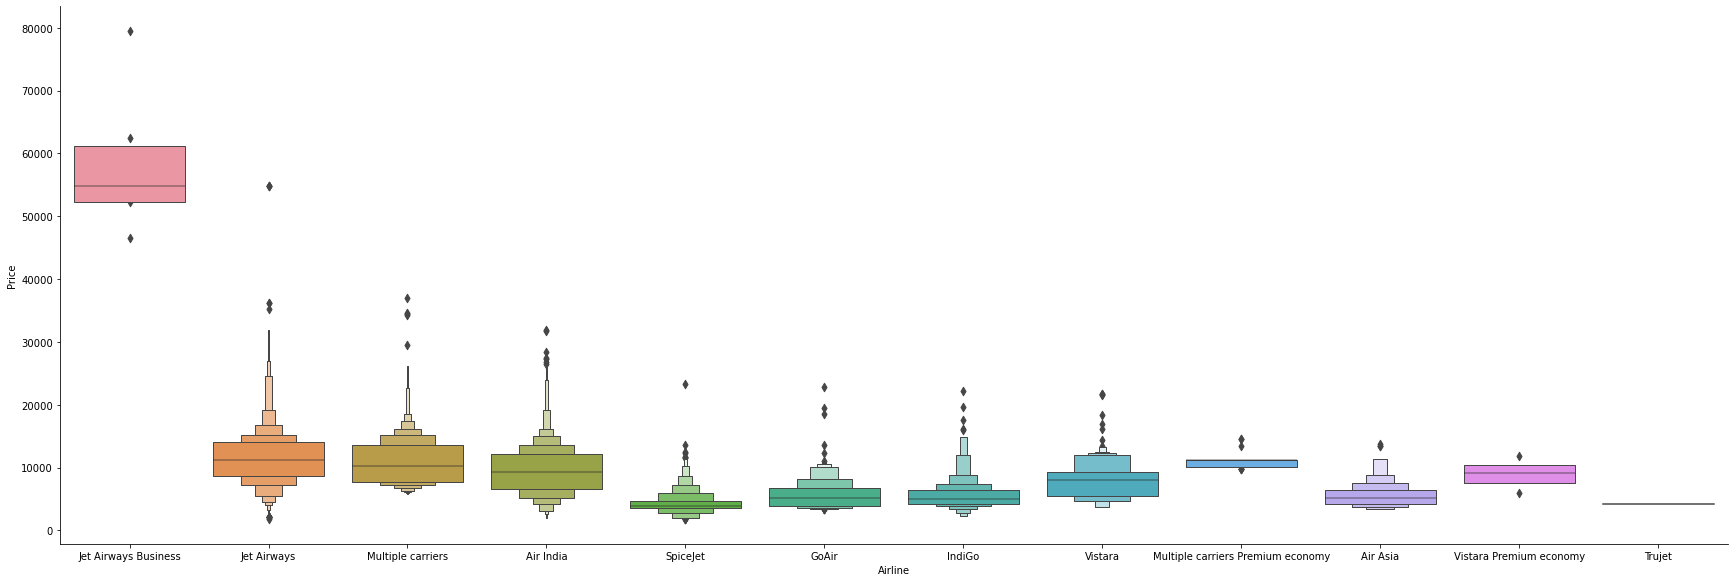
Inference: Here with the help of the cat plot we are trying to plot the boxplot between the price of the flight and airline and we can conclude that Jet Airways has the most outliers in terms of price.
Plotting Violin plot for Price vs Source
sns.catplot(y = "Price", x = "Source", data = train_df.sort_values("Price", ascending = False), kind="violin", height = 4, aspect = 3)
plt.show()
Output:
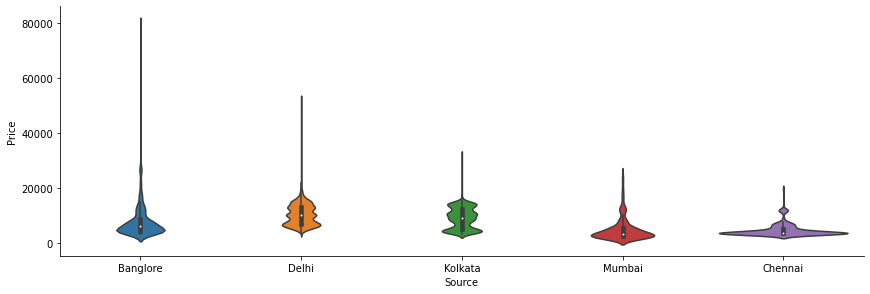
Inference: Now with the help of cat plot only we are plotting a box plot between the price of the flight and the source place i.e. the place from where passengers will travel to the destination and we can see that Banglore as the source location has the most outliers while Chennai has the least.
Plotting Box plot for Price vs Destination
sns.catplot(y = "Price", x = "Destination", data = train_df.sort_values("Price", ascending = False), kind="box", height = 4, aspect = 3)
plt.show()
Output:
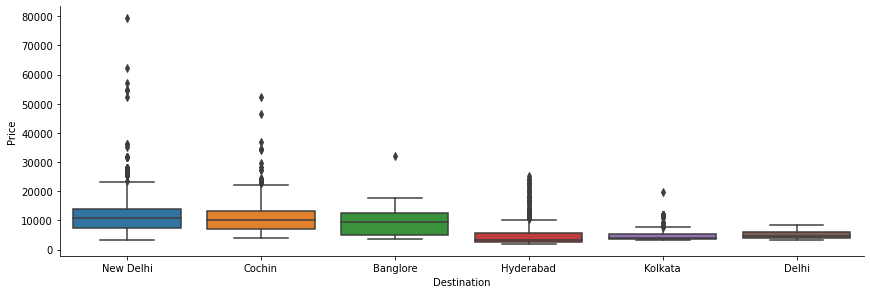
Inference: Here we are plotting the box plot with the help of a cat plot between the price of the flight and the destination to which the passenger is travelling and figured out that New Delhi has the most outliers and Kolkata has the least.
Feature Engineering
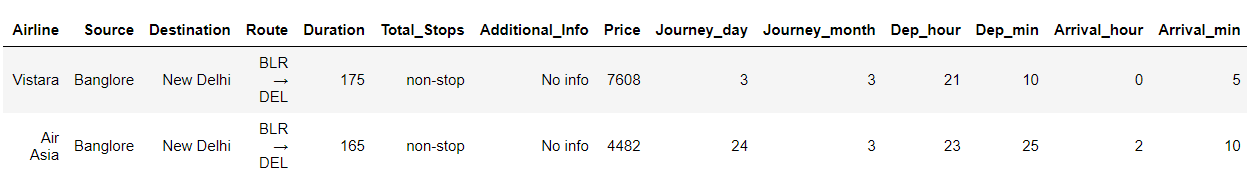
Let’s see our processed data first
train_df.head()
Output:
Here first we are dividing the features and labels and then converting the hours in minutes.
train_df['Duration'] = train_df['Duration'].str.replace("h", '*60').str.replace(' ','+').str.replace('m','*1').apply(eval)
test_df['Duration'] = test_df['Duration'].str.replace("h", '*60').str.replace(' ','+').str.replace('m','*1').apply(eval)
Date_of_Journey: Here we are organizing the format of the date of journey in our dataset for better preprocessing in the model stage.
train_df["Journey_day"] = train_df['Date_of_Journey'].str.split('/').str[0].astype(int)
train_df["Journey_month"] = train_df['Date_of_Journey'].str.split('/').str[1].astype(int)
train_df.drop(["Date_of_Journey"], axis = 1, inplace = True)
Dep_Time: Here we are converting departure time into hours and minutes
train_df["Dep_hour"] = pd.to_datetime(train_df["Dep_Time"]).dt.hour
train_df["Dep_min"] = pd.to_datetime(train_df["Dep_Time"]).dt.minute
train_df.drop(["Dep_Time"], axis = 1, inplace = True)
Arrival_Time: Similarly we are converting the arrival time into hours and minutes.
train_df["Arrival_hour"] = pd.to_datetime(train_df.Arrival_Time).dt.hour
train_df["Arrival_min"] = pd.to_datetime(train_df.Arrival_Time).dt.minute
train_df.drop(["Arrival_Time"], axis = 1, inplace = True)
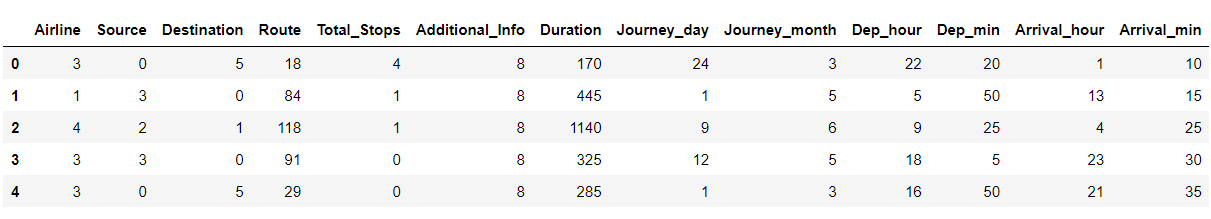
Now after final preprocessing let’s see our dataset
train_df.head()
Output:
Plotting Bar chart for Months (Duration) vs Number of Flights
plt.figure(figsize = (10, 5))
plt.title('Count of flights month wise')
ax=sns.countplot(x = 'Journey_month', data = train_df)
plt.xlabel('Month')
plt.ylabel('Count of flights')
for p in ax.patches:
    ax.annotate(int(p.get_height()), (p.get_x()+0.25, p.get_height()+1), va='bottom', color= 'black')
Output:
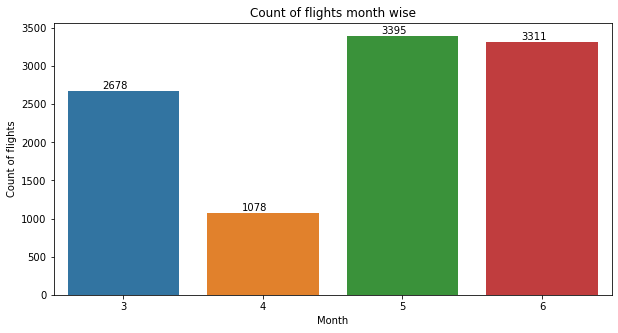
Inference: Here in the above graph we have plotted the count plot for journey in a month vs several flights and got to see that May has the most number of flights.
Plotting Bar chart for Types of Airline vs Number of Flights
plt.figure(figsize = (20,5))
plt.title('Count of flights with different Airlines')
ax=sns.countplot(x = 'Airline', data =train_df)
plt.xlabel('Airline')
plt.ylabel('Count of flights')
plt.xticks(rotation = 45)
for p in ax.patches:
    ax.annotate(int(p.get_height()), (p.get_x()+0.25, p.get_height()+1), va='bottom', color= 'black')
Output:
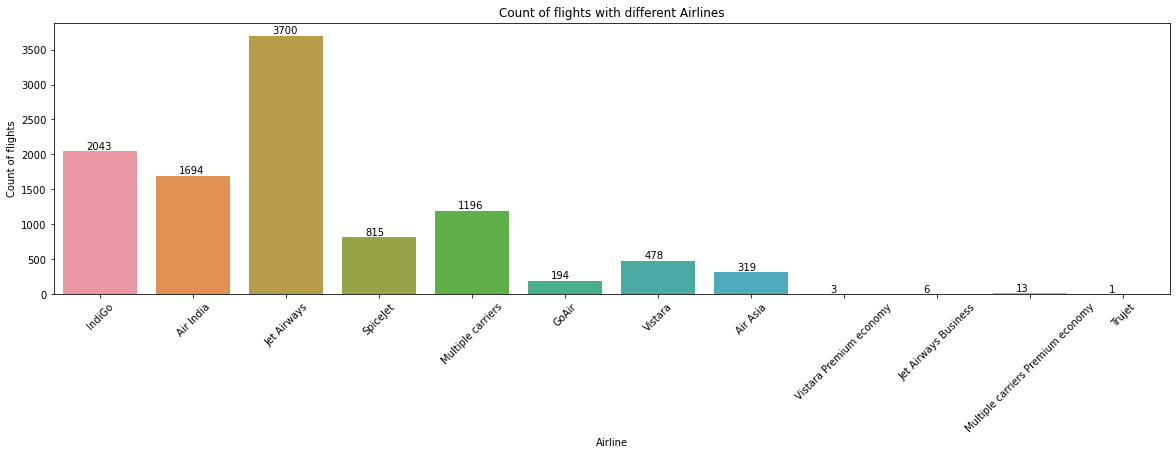
Inference: Now from the above graph we can see that between the type of airline and count of flights we can see that Jet Airways has the most flight boarded.
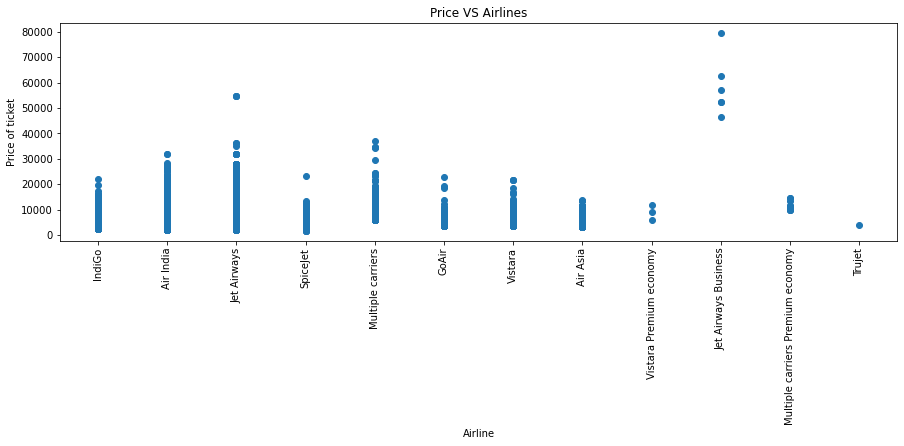
Plotting Ticket Prices VS Airlines
plt.figure(figsize = (15,4))
plt.title('Price VS Airlines')
plt.scatter(train_df['Airline'], train_df['Price'])
plt.xticks
plt.xlabel('Airline')
plt.ylabel('Price of ticket')
plt.xticks(rotation = 90)
Output:
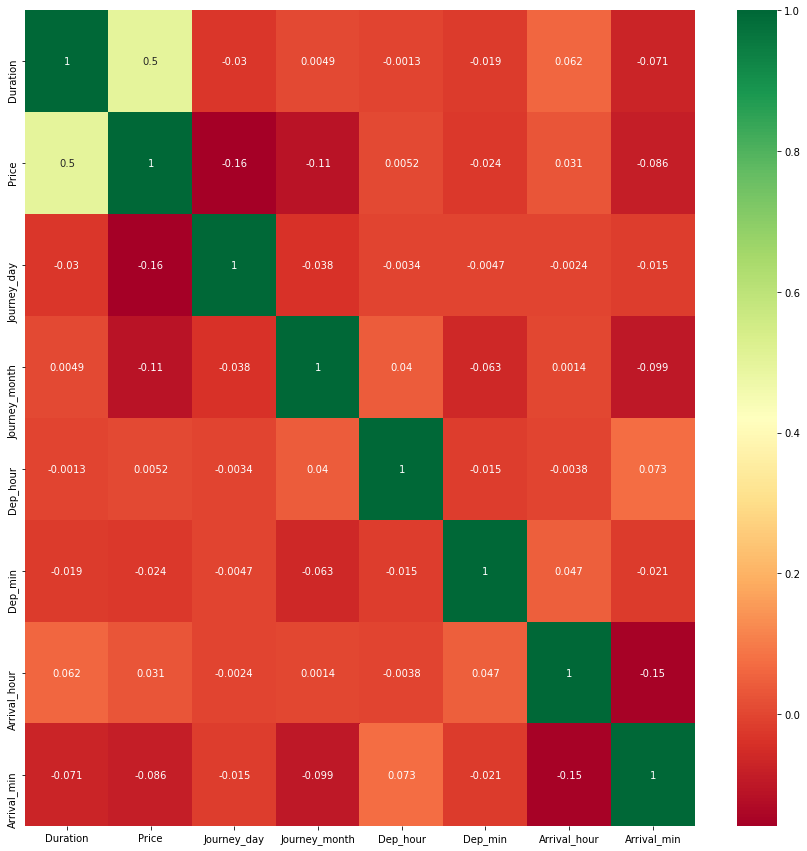
Correlation between all Features
Plotting Correlation
plt.figure(figsize = (15,15))
sns.heatmap(train_df.corr(), annot = True, cmap = "RdYlGn")
plt.show()
Output:
Dropping the Price column as it is of no use
data = train_df.drop(["Price"], axis=1)
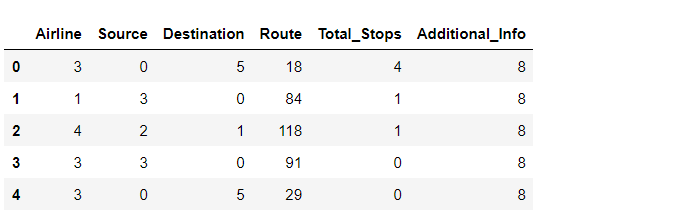
Dealing with Categorical Data and Numerical Data
train_categorical_data = data.select_dtypes(exclude=['int64', 'float','int32'])
train_numerical_data = data.select_dtypes(include=['int64', 'float','int32'])

test_categorical_data = test_df.select_dtypes(exclude=['int64', 'float','int32','int32'])
test_numerical_data  = test_df.select_dtypes(include=['int64', 'float','int32'])
train_categorical_data.head()
Output:
Label Encode and Hot Encode for Categorical Columns
le = LabelEncoder()
train_categorical_data = train_categorical_data.apply(LabelEncoder().fit_transform)
test_categorical_data = test_categorical_data.apply(LabelEncoder().fit_transform)
train_categorical_data.head()
Output:
Concatenating both Categorical Data and Numerical Data
X = pd.concat([train_categorical_data, train_numerical_data], axis=1)
y = train_df['Price']
test_set = pd.concat([test_categorical_data, test_numerical_data], axis=1)
X.head()
Output:
y.head()
Output:
0     3897
1     7662
2    13882
3     6218
4    13302
Name: Price, dtype: int64
Conclusion
So as we saw that we have done a complete EDA process, getting data insights, feature engineering, and data visualization as well so after all these steps one can go for the prediction using machine learning model-making steps.


