


As data scientists, we are expected to develop machine learning models to analyze data and solve business problems. Whether we are developing a simple model or a complex model, model validation is essential to measure the quality of our work.
We need to measure every moving part to ensure the model is adequate from validating the data, the methodology, and the machine learning model metrics. There are many techniques to do machine learning validation. Still, in this article, I want to introduce python packages that would make our life easier when validating the machine learning models.
Here are my top 3 python packages for machine learning validation. Let’s get into it.
1. Evidently
Evidently is an open-source python package to analyze and monitor machine learning models. The package is explicitly developed to establish an easy-to-monitor machine learning dashboard and detect drift in the data. It’s specifically designed with production in mind, so it’s better used when a data pipeline is there. However, you could still use it even in the development phase.
Let’s try using Evidently to validate our machine learning model development. In a real-world environment, we would have a reference dataset and production dataset but for our case right now, let’s use the split train and test data from Kaggle.
As a starter, we need to install the evidently package.
pip install evidentlyAfter installing the package, we could try to detect the data drift that happens in our dataset. Data drift a phenomenon where the data in the reference or in a previous timeline are different from the current data statistically.
import pandas as pdtrain = pd.read_csv('churn-bigml-80.csv')
test = pd.read_csv('churn-bigml-20.csv')
The dataset needs preprocessing, and I want to use only the numerical data for now.
train.drop(['State', 'International plan', 'Voice mail plan'], axis =1,inplace = True)
test.drop(['State', 'International plan', 'Voice mail plan'], axis =1, inplace = True)train['Churn'] = train['Churn'].apply(lambda x: 1 if x == True else 0)
test['Churn'] = test['Churn'].apply(lambda x: 1 if x == True else 0)
After the data is ready, we will build our dashboard to detect any drift. Evidently need us to import each tab independently; for data drift, we would use the DataDriftTab .
from evidently.dashboard import Dashboard
from evidently.tabs import  DataDriftTabdata_drift_report = Dashboard(tabs=[DataDriftTab()])
data_drift_report.calculate(train, test, column_mapping = None)
data_drift_report.save("reports/my_report.html")
We save the data in the HTML report and open it in a different tab.

As you can see in the GIF above, we have a monitor dashboard. We could see each feature distribution and statistical test for data drift in this dashboard. In our sample, between train data and test data did not show any drift — which means all the data distribution is similar. If it is in production, the incoming data and our current data don’t have differences in the pattern.
Evidently could also be used to create a machine learning classification dashboard to monitor machine learning health. For example, let’s train a classification model using the previous data.
from sklearn.neighbors importX_train = train.drop('Churn', axis =1)
X_test = test.drop('Churn', axis =1)
y_train = train['Churn']
y_test = test['Churn']model = KNeighborsClassifier(n_neighbors=5)
model.fit(X_train, y_train)
After fitting the model, we need both the actual and predicted results. We also need the training and test dataset still intact.
train_predictions = model.predict(X_train)
test_predictions = model.predict(X_test)X_train['target'] = y_train
X_train['prediction'] = train_predictionsX_test['target'] = y_test
X_test['prediction'] = test_predictions
The monitor also needs us to map the columns we used; in this case, we would set it up using the ColumnMapping class from Evidently.
from evidently.pipeline.column_mapping import ColumnMappingchurn_column_mapping = ColumnMapping()churn_column_mapping.target = 'target'
churn_column_mapping.prediction = 'prediction'
churn_column_mapping.numerical_features =train.drop('Churn', axis =1).columns
After all the preparation is finished, let’s set up the classifier monitor dashboard.
from evidently.tabs.base_tab import Verbose
from evidently.tabs import ClassificationPerformanceTabchurn_model_performance_dashboard = Dashboard(tabs=[ClassificationPerformanceTab(verbose_level=Verbose.FULL)])
churn_model_performance_dashboard.calculate(X_train, X_test, column_mapping = churn_column_mapping)
churn_model_performance_dashboard.save("reports/classification_churn.html")

As shown in the GIF above, we could monitor our machine learning model metrics as a whole and per feature prediction. The detail is good enough to know if there is a difference when incoming new data.
If you want to know all the dashboards to use on evidently, please refer to the documentation.
2. Deepchecks
Deepchecks is a python package to validate our machine learning model with a few lines. Many APIs are available for detecting data drift, label drift, train-test comparison, evaluating models, and many more. Deepchecks are perfect to use in the research phase and before your model goes into production. You should read more about when to use deepchecks on the following page.
Let’s try using the Deepchecks package to produce a full dataset and model performance report. We would use the full_suite class to make the report.
First, let’s install the Deepchecks package.
pip install deepchecksAfter the installation is done, we need to prepare the training dataset and machine learning model. For our example, I would use the simple Iris dataset from the deepchecks.
import pandas as pd
from deepchecks.datasets.classification import iris
from sklearn.ensemble import RandomForestClassifier# Load Data
iris_df = iris.load_data(data_format='Dataframe', as_train_test=False)
After loading the data, we need to split the train test data and load the machine learning model. You could fit the data with your model, but I would use the readily available model.
df_train, df_test = iris.load_data(data_format='Dataframe', as_train_test=True)
label_col = "target"rf_clf = iris.load_fitted_model()
Deepchecks work better if they transform the Pandas data frame into the Deepchecks dataset object so that we would do that.
from deepchecks import Datasetds_train = Dataset(df_train, label=label_col, cat_features=[])
ds_test =  Dataset(df_test,  label=label_col, cat_features=[])
Everything is ready; we only need to run the full suite report from our Jupyter Notebook.
from deepchecks.suites import full_suitesuite = full_suite()
suite.run(train_dataset=ds_train, test_dataset=ds_test, model=rf_clf)

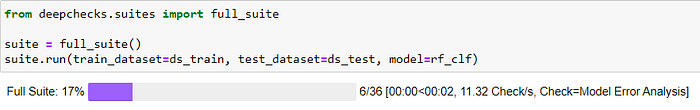

The full suites reports would contain much information such as Confusion Matrix Report, Simple Model Comparison, Mixed Data Types, Data Drift, etc. All the information you need to check the machine learning model is available in a single code run.
3. TensorFlow-Data-Validation
TensorFlow Data Validation or TFDV is a python package developed by TensorFlow developers to manage data quality issues. It is used to automatically describe the data statistic, infer the data schema, and detect any anomalies in the incoming data.
Let’s try to install the package.
pip install tensorflow-data-validationFirst, we need to import the package and generate the statistical object from our CSV data. I would use the train churn dataset we used previously as a reference dataset.
import tensorflow_data_validation as tfdv
stats = tfdv.generate_statistics_from_csv(data_location='churn-bigml-80.csv')
We could visualize the statistical information from the statistic object.
tfdv.visualize_statistics(stats)
The TFDV package is not limited only to generating statistical visualization but is also helpful in detecting any change in the incoming data. We need to infer the original or reference data schema to do this.
schema = tfdv.infer_schema(stats)
tfdv.display_schema(schema)
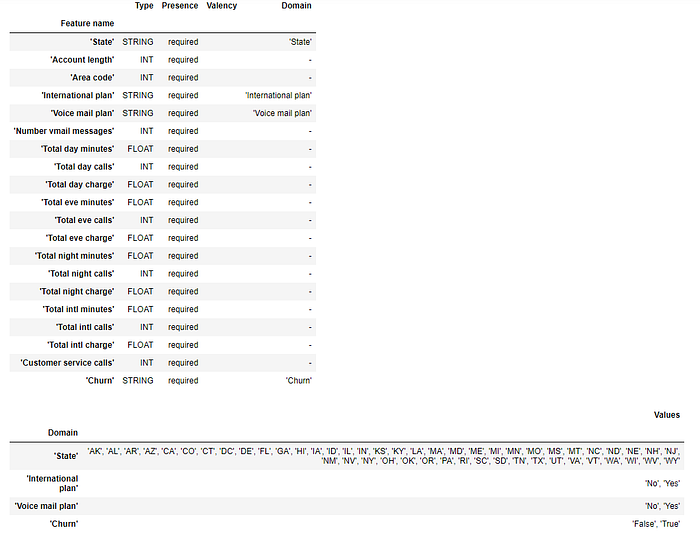
The schema would be used to validate against any incoming data; if the incoming data did not have any columns or categories inferred in the schema, then TFDV would inform the anomalies’ presence. We would do that using the following code and using the test data.
new_csv_stats = tfdv.generate_statistics_from_csv(data_location='churn-bigml-20.csv')

anomalies = tfdv.validate_statistics(statistics=new_csv_stats, schema=schema)tfdv.display_anomalies(anomalies)
Conclusions
The machine learning model project is not a one-time thing; it is a continuous project. The model in production would need to be constantly monitored and controlled if there are any anomalies present. To help us validate the machine learning model, we can use the following python package:
- Evidently
- Deepchecks
- TensorFlow Validation Data


