


R is primarily used for statistical analysis, while Python provides a more general approach to data science. R and Python are object-oriented towards data science for programming language. Learning both is an ideal solution. Python is a common-purpose language with a readable syntax. — www.calltutors.com
The war between R and Python users has been raging for several years. With most of the old school statisticians being trained on R and most computer science and data science departments in universities instead preferring Python, both have pros and cons. The main cons I have noticed in practice are in the packages that are available for each language.
As of 2019, the R packages for cluster analysis and splines are superior to the Python packages of the same kind. In this article, I will show you, with coded examples, how to take R functions and datasets and import and utilize then within a Python-based Jupyter notebook.
The topics of this article are:
- Importing (base) R functions
- Importing R library functions
- Populating vectors R understands
- Populating dataframes R understands
- Populating formulas R understands
- Running models in R
- Getting results back to Python
- Getting model predictions in R
- Plotting in R
- Reading R’s documentation
There is an accompanying notebook to this article that can be found on my GitHub page.mrdragonbear/ArticlesThis repository contains code-related content relevant to my Medium articles. This repository is the master repository…github.com
Linear/Polynomial Regression
Firstly, we will look at performing basic linear and polynomial regression using imported R functions. We will examine a dataset looking at diabetes with information about C-peptide concentrations and acidity variables. Do not worry about the contents of the model, this is a commonly used example in the field of generalized additive models, which we will look at later in the article.
diab = pd.read_csv("data/diabetes.csv")print("""
# Variables are:
#   subject:   subject ID number
#   age:       age diagnosed with diabetes
#   acidity:   a measure of acidity called base deficit
#   y:         natural log of serum C-peptide concentration
#
# Original source is Sockett et al. (1987)
# mentioned in Hastie and Tibshirani's book
# "Generalized Additive Models".
""")display(diab.head())
display(diab.dtypes)
display(diab.describe())
We can then plot the data:
ax0 = diab.plot.scatter(x='age',y='y',c='Red',title="Diabetes data") #plotting direclty from pandas!
ax0.set_xlabel("Age at Diagnosis")
ax0.set_ylabel("Log C-Peptide Concentration");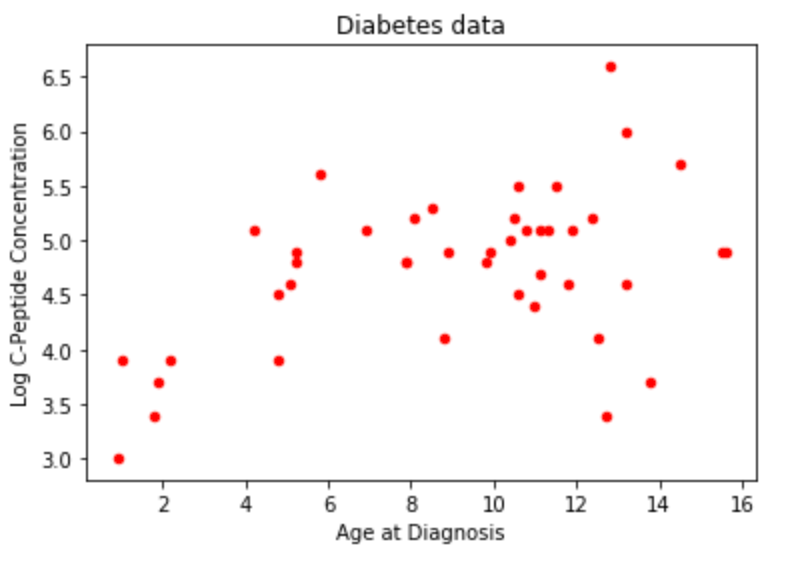
Linear/Polynomial Regression, but make it R
After this section, we’ll know everything we need to in order to work with R models. The rest of the lab is just applying these concepts to run particular models. This section, therefore, is your ‘cheat sheet’ for working in R.
What we need to know:
- Importing (base) R functions
- Importing R Library functions
- Populating vectors R understands
- Populating DataFrames R understands
- Populating Formulas R understands
- Running models in R
- Getting results back to Python
- Getting model predictions in R
- Plotting in R
- Reading R’s documentation
Importing R functions
To import R functions we need the rpy2 package. Depending on your environment, you may also need to specify the path to the R home directory. I have given an example below for how to specify this.
# if you're on JupyterHub you may need to specify the path to R

#import os
#os.environ['R_HOME'] = "/usr/share/anaconda3/lib/R"

import rpy2.robjects as robjects
To specify an R function, simply use robjects.r followed by the name of the package in square brackets as a string. To prevent confusion, I like to use r_ for functions, libraries, and other objects imported from R.
r_lm = robjects.r["lm"]
r_predict = robjects.r["predict"]
#r_plot = robjects.r["plot"] # more on plotting later

#lm() and predict() are two of the most common functions we'll use
Importing R libraries
We can import individual functions, but we can also import entire libraries too. To import an entire library, you can extract the importr package from rpy2.robjects.packages .
from rpy2.robjects.packages import importr
#r_cluster = importr('cluster')
#r_cluster.pam;
Populating vectors R understands
To specify a float vector that can interface with Python packages, we can use the robjects.FloatVector function. The argument to this function references the data array that you wish to convert to an R object, in our case, the age and y variables from our diabetes dataset.
r_y = robjects.FloatVector(diab['y'])
r_age = robjects.FloatVector(diab['age'])
# What happens if we pass the wrong type?
# How does r_age display?
# How does r_age print?
Populating Dataframes R understands
We can specify individual vectors, and we can also specify entire dataframes. This is done by using the robjects.DataFrame function. The argument to this function is a dictionary specifying the name and the vector (obtained from robjects.FloatVector ) associated with the name.
diab_r = robjects.DataFrame({"y":r_y, "age":r_age})
# How does diab_r display?
# How does diab_r print?
Populating formulas R understands
To specify a formula, for example, for regression, we can use the robjects.Formula function. This follows the R syntax dependent variable ~ independent variables . In our case, the output y is modeled as a function of the age variable.
simple_formula = robjects.Formula("y~age")
simple_formula.environment["y"] = r_y #populate the formula's .environment, so it knows what 'y' and 'age' refer to
simple_formula.environment["age"] = r_age
Notice in the above formula we had to specify the FloatVector’s associated with each of the variables in our formula. We have to do this as the formula does not automatically relate our variable names to variables that we have previously specified — they have not yet been associated with the robjects.Formula object.
Running Models in R
To specify a model, in this case a linear regression model using our previously imported r_lm function, we need to pass our formula variable as an argument (this will not work unless we pass an R formula object).
diab_lm = r_lm(formula=simple_formula) # the formula object is storing all the needed variables
Instead of specifying each of the individual float vectors related to the robjects.Formula object, we can reference the dataset in the formula itself (as long as this has been made into an R object itself).
simple_formula = robjects.Formula("y~age") # reset the formula
diab_lm = r_lm(formula=simple_formula, data=diab_r) #can also use a 'dumb' formula and pass a dataframe
Getting results back to Python
Using R functions and libraries is great, but we can also analyze our results and get them back to Python for further processing. To look at the output:
diab_lm #the result is already 'in' python, but it's a special object
We can also check the names in our output:
print(diab_lm.names) # view all names
To take the first element of our output:
diab_lm[0] #grab the first element
To take the coefficients:
diab_lm.rx2("coefficients") #use rx2 to get elements by name!To put the coefficients in a Numpy array:
np.array(diab_lm.rx2("coefficients")) #r vectors can be converted to numpy (but rarely needed)Getting Predictions
To get predictions using our R model, we can create a prediction dataframe and use the r_predict function, similar to how it is done using Python.
# make a df to predict on (might just be the validation or test dataframe)
predict_df = robjects.DataFrame({"age": robjects.FloatVector(np.linspace(0,16,100))})# call R's predict() function, passing the model and the data
predictions = r_predict(diab_lm, predict_df)
We can use the rx2 function to extract the ‘age’ values:
x_vals = predict_df.rx2("age")We can also plot our data using Python:
ax = diab.plot.scatter(x='age',y='y',c='Red',title="Diabetes data")
ax.set_xlabel("Age at Diagnosis")
ax.set_ylabel("Log C-Peptide Concentration");ax.plot(x_vals,predictions); #plt still works with r vectors as input!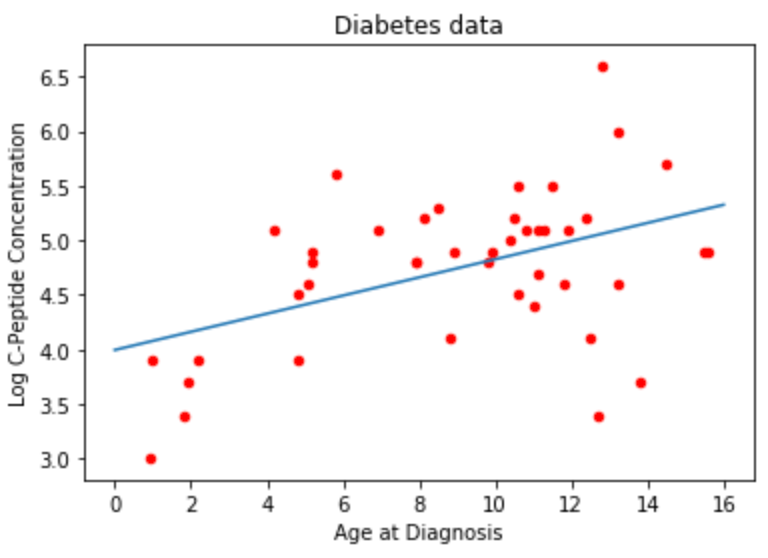
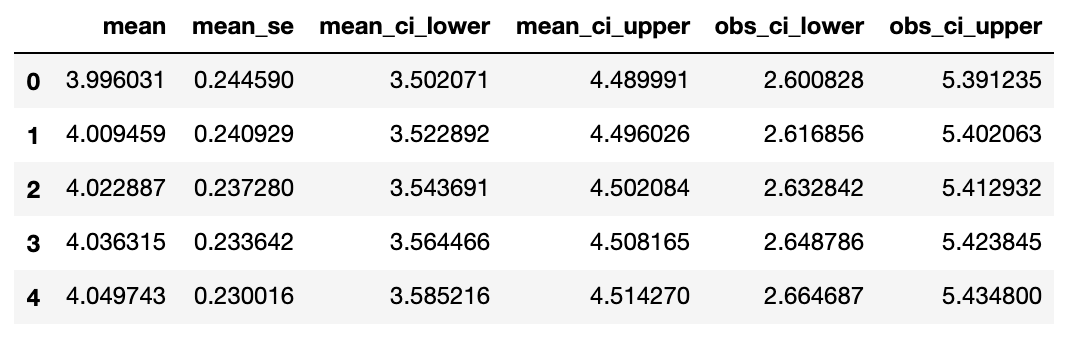
We can also fit a 3rd-degree polynomial model and plot the model error bars in two ways:
- Route1: Build a design df with a column for each of
age,age**2,age**3
fit2_lm = sm.ols(formula="y ~ age + np.power(age, 2) + np.power(age, 3)",data=diab).fit()

poly_predictions = fit2_lm.get_prediction(predict_df).summary_frame()
poly_predictions.head()


