





It is very important to know how LIME reaches to its final outputs for explaining a prediction done for text data. In this article, I have shared that concept by enlightening the components of LIME.
Few weeks back I wrote a blog on how different interpretability tools can be used to interpret certain predictions done by the black-box models. In that article I shared the mathematics behind LIME, SHAP and other interpretability tools, but I did not go much into details of implementing those concepts on original data. In this article, I thought of sharing how LIME works on text data in a step-by-step manner.
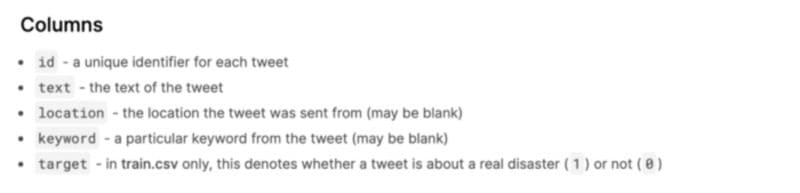
The data that is used for the whole analysis is taken from here . This data is for predicting whether a given tweet is about a real disaster(1) or not(0). It has the following columns:
Source
As the main focus of this blog is to interpret LIME and its different components so we will quickly build a binary text classification model using Random Forest and will focus mainly on LIME interpretation.
First, we start with importing the necessary packages. Then we read the data and start preprocessing like stop words removal, Lowercase, lemmatization, punctuation removal, whitespace removal etc. All the cleaned preprocessed text are stored in a new ‘cleaned_text’ column which will be further used for analysis and the data is split into train and validation set in a ratio of 80:20.
Then we quickly move to converting the text data into vectors using TF-IDF vectoriser and fitting a Random Forest classification model on that.
| import pandas as pd | |
| import numpy as np | |
| import seaborn as sns | |
| #for text pre-processing | |
| import re, string | |
| import nltk | |
| from nltk.tokenize import word_tokenize | |
| from nltk.corpus import stopwords | |
| from nltk.tokenize import word_tokenize | |
| from nltk.stem import SnowballStemmer | |
| from nltk.corpus import wordnet | |
| from nltk.stem import WordNetLemmatizer | |
| #for model-building | |
| from sklearn.model_selection import train_test_split | |
| from sklearn.ensemble import RandomForestClassifier | |
| from sklearn.metrics import classification_report, f1_score, accuracy_score, confusion_matrix,roc_curve,auc | |
| # bag of words | |
| from sklearn.feature_extraction.text import TfidfVectorizer | |
| from sklearn.feature_extraction.text import CountVectorizer | |
| # Read the data | |
| df_train=pd.read_csv(“/Users/ayankundu/Downloads/nlp-getting-started/train.csv”) | |
| df_test=pd.read_csv(“/Users/ayankundu/Downloads/nlp-getting-started/test.csv”) | |
| #convert to lowercase, strip and remove punctuations | |
| def preprocess(text): | |
| text = text.lower() | |
| text=text.strip() | |
| text=re.compile(‘<.*?>’).sub(”, text) | |
| text = re.compile(‘[%s]’ % re.escape(string.punctuation)).sub(‘ ‘, text) | |
| text = re.sub(‘\s+’, ‘ ‘, text) | |
| text = re.sub(r’\[[0-9]*\]’,‘ ‘,text) | |
| text=re.sub(r'[^\w\s]’, ”, str(text).lower().strip()) | |
| text = re.sub(r’\d’,‘ ‘,text) | |
| text = re.sub(r’\s+’,‘ ‘,text) | |
| text=‘ ‘.join([i for i in text.split() if i not in stopwords.words(‘english’)]) | |
| return text | |
| #LEMMATIZATION | |
| # Initialize the lemmatizer | |
| wl = WordNetLemmatizer() | |
| # function to map NTLK position tags | |
| def get_wordnet_pos(tag): | |
| if tag.startswith(‘J’): | |
| return wordnet.ADJ | |
| elif tag.startswith(‘V’): | |
| return wordnet.VERB | |
| elif tag.startswith(‘N’): | |
| return wordnet.NOUN | |
| elif tag.startswith(‘R’): | |
| return wordnet.ADV | |
| else: | |
| return wordnet.NOUN | |
| # Tokenize the sentence | |
| def lemmatizer(string): | |
| word_pos_tags = nltk.pos_tag(word_tokenize(string)) # Get position tags | |
| a=[wl.lemmatize(tag[0], get_wordnet_pos(tag[1])) for idx, tag in enumerate(word_pos_tags)] # Map the position tag and lemmatize the word/token | |
| return ” “.join(a) | |
| def finalpreprocess(text): | |
| return lemmatizer(preprocess(text)) | |
| df_train[‘cleaned_text’] = df_train[‘text’].apply(lambda x: finalpreprocess(x)) | |
| #SPLITTING THE TRAINING DATASET INTO TRAINING AND VALIDATION | |
| X_train, X_val, y_train, y_val = train_test_split(df_train[“cleaned_text”],df_train[“target”],test_size=0.2, shuffle=True) | |
| #TF-IDF | |
| # Convert x_train to vector | |
| tfidf_vectorizer = TfidfVectorizer(use_idf=True) | |
| X_train_vectors_tfidf = tfidf_vectorizer.fit_transform(X_train) | |
| X_val_vectors_tfidf = tfidf_vectorizer.transform(X_val) | |
| #model | |
| model=RandomForestClassifier(n_estimators = 100, random_state = 10) | |
| model.fit(X_train_vectors_tfidf, y_train) | |
| #Predict y value for test dataset | |
| y_pred = model.predict(X_val_vectors_tfidf) | |
| y_prob = model.predict_proba(X_val_vectors_tfidf)[:,1] | |
| print(classification_report(y_val,y_pred)) | |
| print(‘Confusion Matrix:’,confusion_matrix(y_val, y_pred)) | |
| fpr, tpr, thresholds = roc_curve(y_val, y_prob) | |
| roc_auc = auc(fpr, tpr) | |
| print(‘AUC:’, roc_auc) |
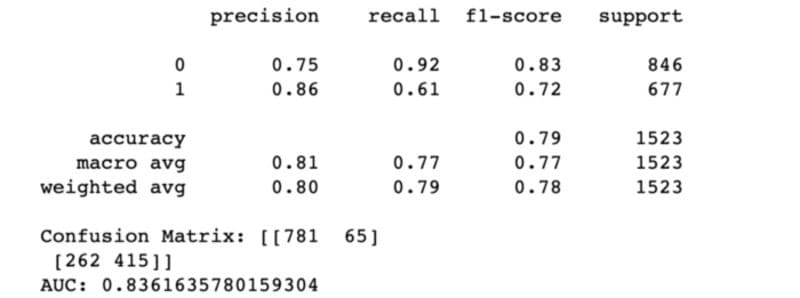
Now let’s begin the main interest of this blog which is how to interpret different components of LIME.
First let’s see what is the final output of the LIME interpretation for a particular data instance. Then we will go deep dive into the different components of LIME in a step by step manner which will finally result the desired output.
| # for LIME import necessary packages | |
| from lime import lime_text | |
| from lime.lime_text import LimeTextExplainer | |
| from sklearn.pipeline import make_pipeline | |
| from lime.lime_text import IndexedString,IndexedCharacters | |
| from lime.lime_base import LimeBase | |
| from sklearn.linear_model import Ridge, lars_path | |
| from lime.lime_text import explanation | |
| from functools import partial | |
| import scipy as sp | |
| from sklearn.utils import check_random_state | |
| # Explaining the predictions and important features for predicting the label 1 | |
| c = make_pipeline(tfidf_vectorizer, model) | |
| explainer = LimeTextExplainer(class_names=model.classes_) | |
| # classifier_fn is the probability function that takes a string and returns prediction probabilities. | |
| # num_features is the max. number of features we want in the explanation(default is 10). | |
| # labels=(1,) means we want the explanation for the label 1 | |
| exp = explainer.explain_instance(X_val.iloc[20], c.predict_proba, num_features=5,labels=(1,)) | |
| exp.show_in_notebook() |

Here labels=(1,) is passed as an argument that means we want the explanation for the class 1. The features (words in this case) highlighted with orange are the top features that cause a prediction of class 0 (not disaster) with probability 0.75 and class 1(disaster) with probability 0.25.
NOTE: char_level is one of the arguments for LimeTextExplainer which is a boolean identifying that we treat each character as an independent occurrence in the string. Default is False so we don’t consider each character independently and IndexedString function is used for tokenization and indexing the words in the text instance, otherwise IndexedCharacters function is used.
So, you must be interested to know how these are calculated. Right?
Let’s see that.
LIME starts with creating some perturbed samples around the neighbourhood of data point of interest. For text data, perturbed samples are created by randomly removing some of the words from the instance and cosine distance is used to calculate the distance between the original and perturbed samples as default metric.
| ## Perturbed samples are created in the neighbourhood of the instance of interest. | |
| # classifier_fn is the probability function that takes a string and returns prediction probabilities. | |
| # 5000 samples are created in the neighbourhood as default. | |
| # Cosine distance is computed to calculate the distance between original and perturbed samples(default). | |
| data,yss,distances=explainer._LimeTextExplainer__data_labels_distances(IndexedString(X_val.iloc[20]),classifier_fn=c.predict_proba,num_samples=5000) | |
| ## Top 2 closest perturbed samples | |
| df=pd.DataFrame(distances,columns=[‘distance’]) | |
| df1=df.sort_values(by=‘distance’) | |
| req_index=df1.index[1:3] | |
| closest_perturbed_sample=[] | |
| for k in req_index: | |
| perturbed_text=‘ ‘.join([re.split(r’\W+’,X_val.iloc[20])[i] for i,x in enumerate(data[k]) if x==1.0]) | |
| closest_perturbed_sample.append(perturbed_text) | |
| closest_perturbed_sample |
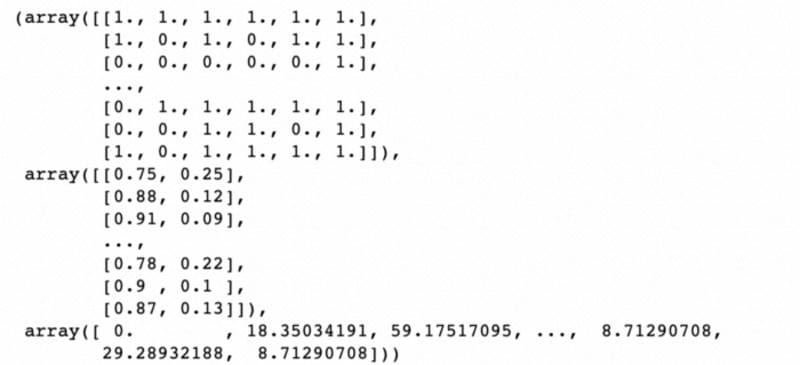
This returns the array of 5000 perturbed samples(each perturbed sample is of length of the original instance and 1 means the word in that position of the original instance is present in the perturbed sample), their corresponding prediction probabilities and the cosine distances between the original and perturbed samples.A snippet of that is as follows:
Now after creating the perturbed samples in the neighbourhood it’s time to give weights to those samples. Samples that are near from the original instance are given higher weightage than the samples far from the original instance. Exponential kernel with kernel width 25 is used as default to give those weightage.
| ## Giving weightage to the perturbed samples | |
| # Exponential kernel | |
| def kernel(d, kernel_width): | |
| return np.sqrt(np.exp(–(d ** 2) / kernel_width ** 2)) | |
| # exponential kernel with kernel width 25 | |
| kernel_fn = partial(kernel, kernel_width=25) | |
| # Samples weight using exponential kernel | |
| weights=kernel_fn(distances) |
After that important features(as per num_features: max number of features to be explained) are selected by learning a locally linear sparse model from perturbed data. There are several methods for choosing the important features using the local linear sparse model like ‘auto’(default), ‘forward_selection’, ‘lasso_path’, ‘highest_weights’. If we choose ‘auto’ then ‘forward_selection’ is used if num_features≤6, else ‘highest_weights’ is used.
| # local sparse model for selecting the important features | |
| local_model=LimeBase(kernel_fn, verbose=False) | |
| # method is the method of selecting the features. | |
| # data is the perturbed samples that are created | |
| # labels_column is the label for which we want the explanation | |
| # weights is the weights that are given by the exponential kernel to the perturbed samples | |
| # num_features is the max. number of features we need in the explanation | |
| labels_column = yss[:, 1] | |
| used_features=local_model.feature_selection(data,labels_column,weights,num_features=5,method=‘auto’) |

Here we can see that the features selected are [1,5,0,2,3] which are the indices of the important words(or features) in the original instance. As here num_features=5 and method=‘auto’, ‘forward_selection’ method is used for selecting the important features.
Now let’s see what will happen if we choose method as ‘lasso_path’.

Same. Right?
But you might be interested to go deep dive into this process of selection. Don’t worry, I will make that easy.
It uses the concept of Least angle regression for selecting the top features.
| # if method=’lasso_path’ | |
| weighted_data = ((data – np.average(data, axis=0, weights=weights)) | |
| * np.sqrt(weights[:, np.newaxis])) | |
| weighted_labels = ((labels_column – np.average(labels_column, weights=weights)) | |
| * np.sqrt(weights)) | |
| # coefficients along the lasso path | |
| _, coefs=local_model.generate_lars_path(weighted_data,weighted_labels) | |
| # Selecting the top 5 important features from the path | |
| for i in range(len(coefs.T) – 1, 0, –1): | |
| nonzero = coefs.T[i].nonzero()[0] | |
| if len(nonzero) <= 5: # num_features=5 | |
| break | |
| used_features1 = nonzero | |
| used_features1 |
Let’s see what will happen if we select method as ‘highest_weights’.

Hang on. We are going deeper in the selection process.
| # if method=’highest_weights’ | |
| clf = Ridge(alpha=0.01, fit_intercept=True,) | |
| clf.fit(data, labels_column, sample_weight=weights) | |
| coef = clf.coef_ | |
| # If the perturbed data is very much sparse we pad features | |
| if sp.sparse.issparse(data): | |
| coef = sp.sparse.csr_matrix(clf.coef_) | |
| weighted_data = coef.multiply(data[0]) | |
| # Note: most efficient to slice the data before reversing | |
| sdata = len(weighted_data.data) | |
| argsort_data = np.abs(weighted_data.data).argsort() | |
| # Edge case where data is more sparse than requested number of feature importances | |
| # In that case, we just pad with zero-valued features | |
| if sdata < num_features: | |
| nnz_indexes = argsort_data[::–1] | |
| indices = weighted_data.indices[nnz_indexes] | |
| num_to_pad = num_features – sdata | |
| indices = np.concatenate((indices, np.zeros(num_to_pad, dtype=indices.dtype))) | |
| indices_set = set(indices) | |
| pad_counter = 0 | |
| for i in range(data.shape[1]): | |
| if i not in indices_set: | |
| indices[pad_counter + sdata] = i | |
| pad_counter += 1 | |
| if pad_counter >= num_to_pad: | |
| break | |
| else: | |
| nnz_indexes = argsort_data[sdata – num_features:sdata][::–1] | |
| indices = weighted_data.indices[nnz_indexes] | |
| else: | |
| weighted_data = coef * data[0] | |
| feature_weights = sorted( | |
| zip(range(data.shape[1]), weighted_data), | |
| key=lambda x: np.abs(x[1]), | |
| reverse=True) | |
| np.array([x[0] for x in feature_weights[:5]]) # num_features=5 |
So now the important features we have selected by using any one of the methods. But finally we will have to fit a local linear model to explain the prediction done by the black-box model. For that Ridge Regression is used as default.
| # After getting the features Ridge regression is used to fit the local model as default | |
| model_regressor = Ridge(alpha=1, fit_intercept=True) | |
| easy_model = model_regressor | |
| easy_model.fit(data[:, used_features], | |
| labels_column, sample_weight=weights) | |
| prediction_score = easy_model.score( | |
| data[:, used_features], | |
| labels_column, sample_weight=weights) | |
| local_pred = easy_model.predict(data[0, used_features].reshape(1, –1)) | |
| # final output | |
| local_model.explain_instance_with_data(data,yss,distances,label=1,num_features=5,feature_selection=‘highest_weights’) |
Let’s check how the outputs will look like finally.
If we select method as auto, highest_weights and lasso_path respectively the output will look like this:
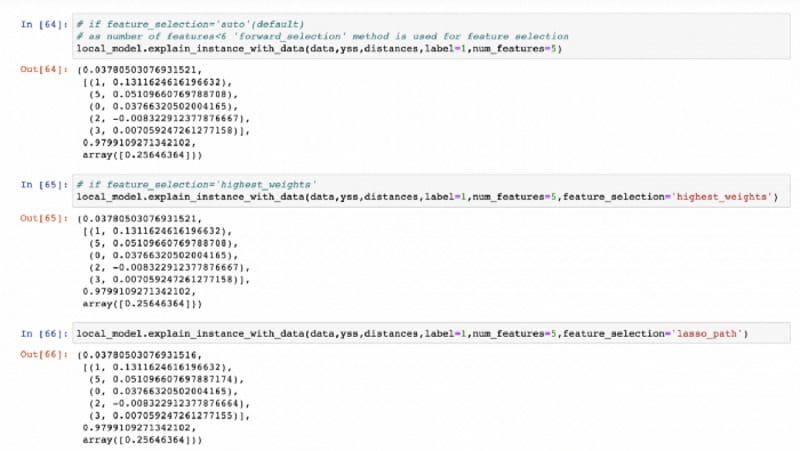
These return a tuple (intercept of the local linear model, important features indices and its coefficients, R² value of the local linear model, local prediction by the explanation model on the original instance).
If we compare the above image with

then we can say that the prediction probabilities given in the left most panel is the local prediction done by the explanation model. The features and the values given in the middle panel are the important features and their coefficients.
NOTE: As for this particular data instance the number of words(or features) is only 6 and we are selecting the top 5 important features , all the methods are giving the same set of top 5 important features. But it may not happen for longer sentences.
Conclusion
In this article, I tried to explain the final outcome of LIME for text data and how the whole explanation process happens for text in a step by step manner. Similar explanations can be done for tabular and image data. For that I will highly recommend to go through this.
References
- GitHub repository for LIME : https://github.com/marcotcr/lime
- Documentation on LARS: http://www.cse.iitm.ac.in/~vplab/courses/SLT/PDF/LAR_hastie_2018.pdf
- https://towardsdatascience.com/python-libraries-for-interpretable-machine-learning-c476a08ed2c7


